Data analysis has become fundamental to businesses in today’s world, allowing them to understand and gain a competitive advantage in their markets. Businesses today require powerful analytics tools to help them make sense of the massive amounts of data generated daily. Google Analytics 4 (GA4) is an effective system that helps companies gain deep insights about their customers, enhance their marketing performance, and drive brand success, leading to increasing revenue.
After Universal Analytics was discontinued, Google released Google Analytics 4 to help companies learn more about customer habits across all devices and operating systems. GA4’s many enhancements and new features make it a crucial resource for data-driven decision-making. This article will provide a brief overview of each core section of GA4 and how they can be applied to advanced data analysis and marketing research.
Table of Contents
Leveraging GA4 For Marketing Insights
GA4 is made up of 4 core pillars for data analysis:
- Reports: Google Analytics reports offer various insights into the customer journey, including details on user access, traffic sources, on-site activities, and user retention. These reports help businesses understand how users interact with their websites and retain them effectively.
- Exploration: This section helps companies to create custom reports and display advanced data visualizations. Businesses can dive deeper into their data to generate custom insights and present them in sophisticated visual formats to break down the data and discover weaknesses or new opportunities.
- Advertising: Google Analytics offers comprehensive insights into conversion performance comparison across all channels, empowering businesses to evaluate and distribute resources to different channels effectively and reasonably.
- Configure: Since every business is unique, it’s essential to configure your GA4 according to your specific requirements. Google Analytics 4, allows you to oversee and control your custom GA4 event parameters & dimensions, audience, conversions, and over 23 other setups tailored to your specific requirements.
AI-driven analytics with GA4
For businesses looking for more advanced analysis features, Google Analytics 4 can be customized to meet specific business goals with AI features. Here are just a few of the AI features that GA4 offers.
Predictive analytics:
GA4 has Artificial Intelligence (AI) and Machine Learning (ML) capabilities which can provide automated insights from your data. For example, which users are likely to churn or which users are likely to make purchases?
Anomaly detection:
GA4 detects anomalies when it spots something that should have happened on your website but didn’t and can alert you.
Automated Alerts:
GA4 can be used to create automated triggers to send alerts.
Audience Capabilities:
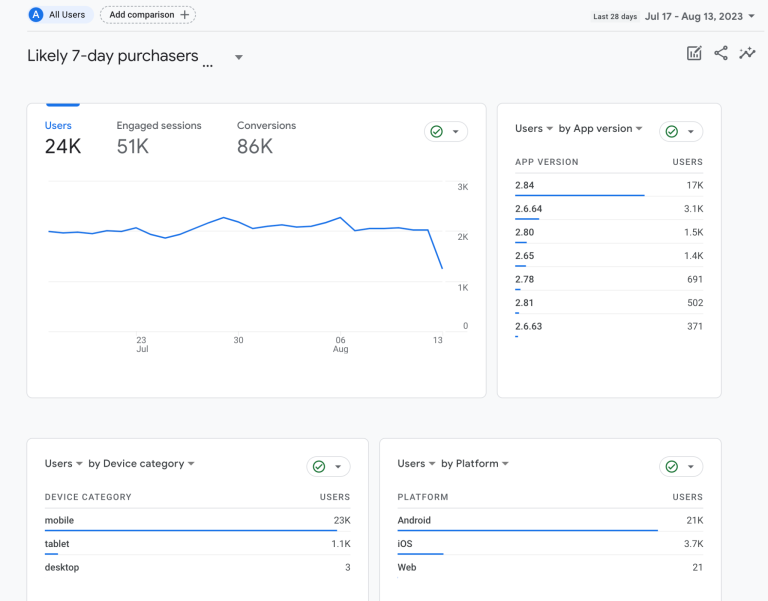
- Audience creation: Create audiences based on user behavior. For example, you could create an audience of “likely 7-day purchasers” that includes users who are predicted to make a purchase within the next 7 days.
- Audience targeting: Target marketing campaigns to specific audiences. For example, you could target promotions for users who have abandoned their shopping carts.
- Audience insights: Generate insights about your audiences. For example, GA4 might suggest that you create a new marketing campaign for a particular audience or change the content on your website to appeal to a specific audience.
With new advanced analysis features, businesses can easily create the right reports and automatically get notified when important changes in the data are discovered.
Reports
The Reports snapshot is the general overview.
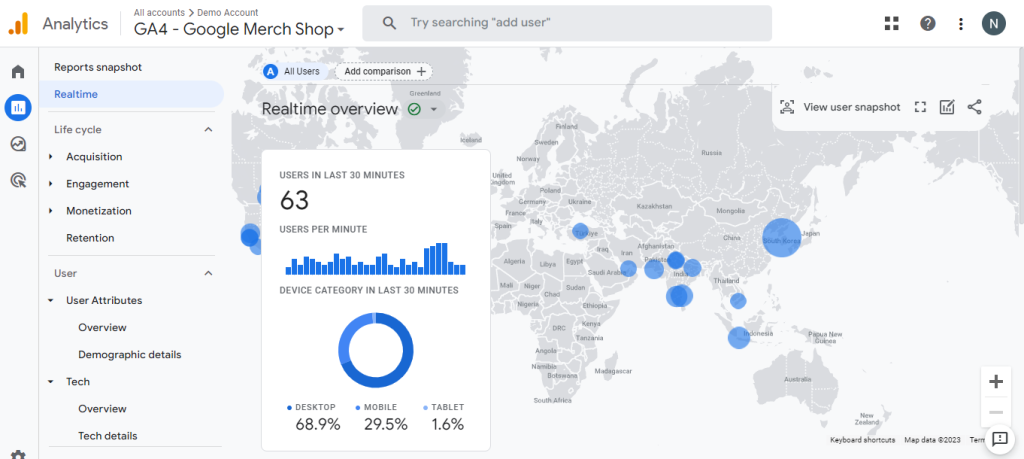
Realtime
GA4 real-time data analysis helps businesses monitor user behavior as it happens. This data will show how many users & their locations within approximately 30 minutes. From here, you can also see what devices are being used. This is a great way to see how user behavior and campaigns are going live.
Example Scenario: A Product Launch Campaign
A Performance Marketer tasked with overseeing a product launch campaign for a new line of fitness equipment. Your goal is to generate buzz, drive traffic to the website, and encourage immediate conversions.
Data Analysis Example: Tracking Conversions
With the Realtime section, you can ensure conversions are accurately tracked as they happen. You can even take it further by filtering the data or creating a comparison by country or mobile device to find which ones are converting better.
Life Cycle
The lifecycle in Google Analytics 4 (GA4) is used to help track and understand the journey of a user interacting with a website or app. It is designed to provide insights into how users behave, engage, and convert over time. The lifecycle in GA4 consists of four key stages: Acquisition, Engagement, Monetization, and Retention. Let’s explore each of these stages in more detail below.
Acquisition - “Learn About Where Your Users are Coming From.
Acquisition focuses on how users discover and access your website or app. It tracks the sources of traffic, such as organic search, paid advertising, social media, or referrals. Understanding acquisition helps businesses identify effective marketing channels. The 3 main reports of the acquisition section are:
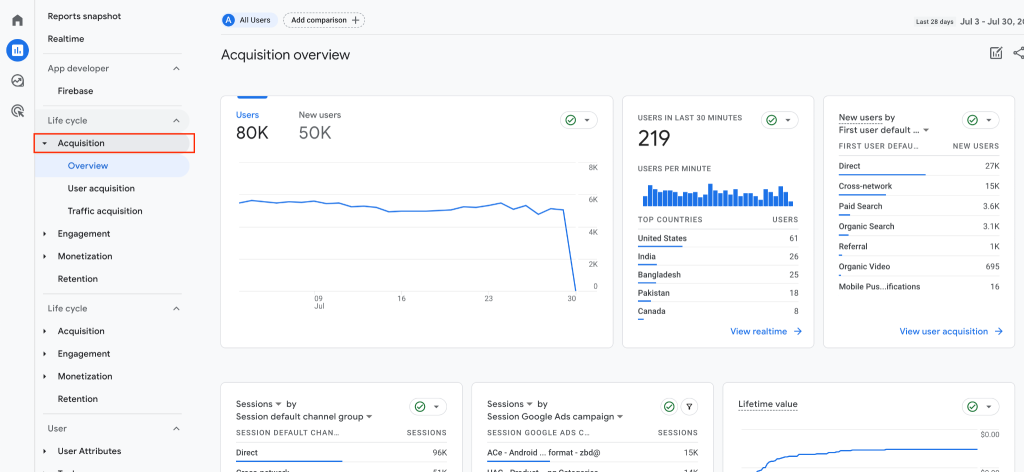
Overview:
The overview gives a concise snapshot of how users discover and interact with websites or apps. It presents key metrics related to different traffic sources, such as organic search, direct visits, referrals, and campaigns, providing insights into user engagement and acquisition performance.
User Acquisition:
Provides a comprehensive analysis of new user acquisition for your website or app, with data from various channels like organic search, paid search, social media, and direct visits, helping to evaluate the performance of each channel in driving traffic and conversions
Traffic Acquisition:
Want to understand how all users are finding your digital property and which channels are driving the most traffic? This section provides insights into the sources and channels through which users discover and access your website or app. It offers data on organic search, paid search, social media, direct visits, and other sources.
Example Scenario: Launching a Fitness Subscription App
As a Performance Marketer, you are in charge of launching all campaigns for a Fitness Equipment company. Currently, you run campaigns using social media, email marketing, & Paid Ads (PPC). You want to see how the campaigns are performing and make sure that they are getting a good user engagement on the investment.
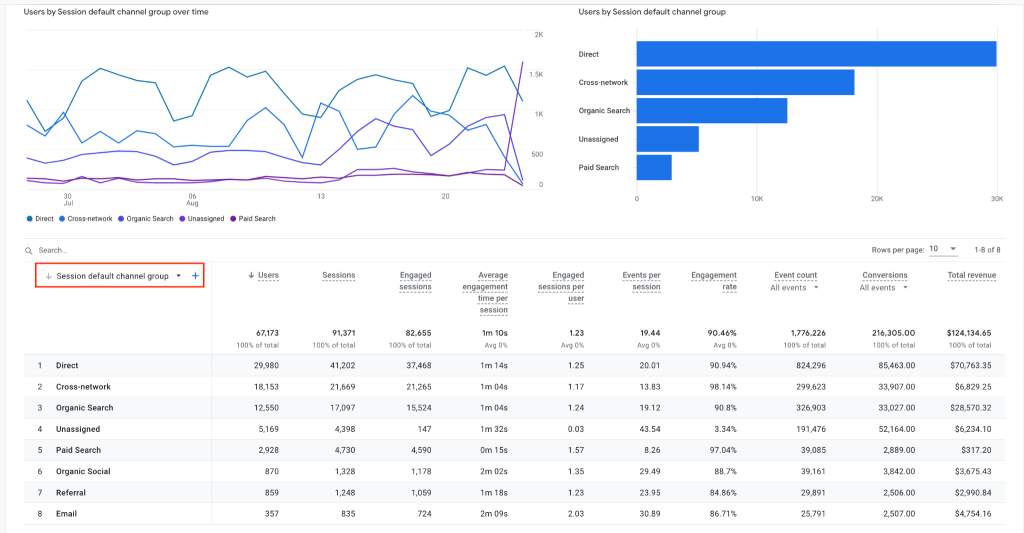
Data Analysis Example: Measuring Conversion Rates
You can use the GA4 Acquisition report to track the performance of your different campaigns and traffic channels. Within the Traffic Acquisition report, select filter by Session Campaign, and you will see a list of campaigns and their conversion results. This information aids in identifying the most effective channels, facilitating adjustments in budget allocation for diverse channels.
Engagement - “Discover the behaviors of your users”
In GA4, the engagement section analyzes where the interactions and behaviors of users on your website or app are tracked. Important metrics like events, conversions, pages & screen views, and landing page tracking can be found here. Let’s examine each section in more detail below.
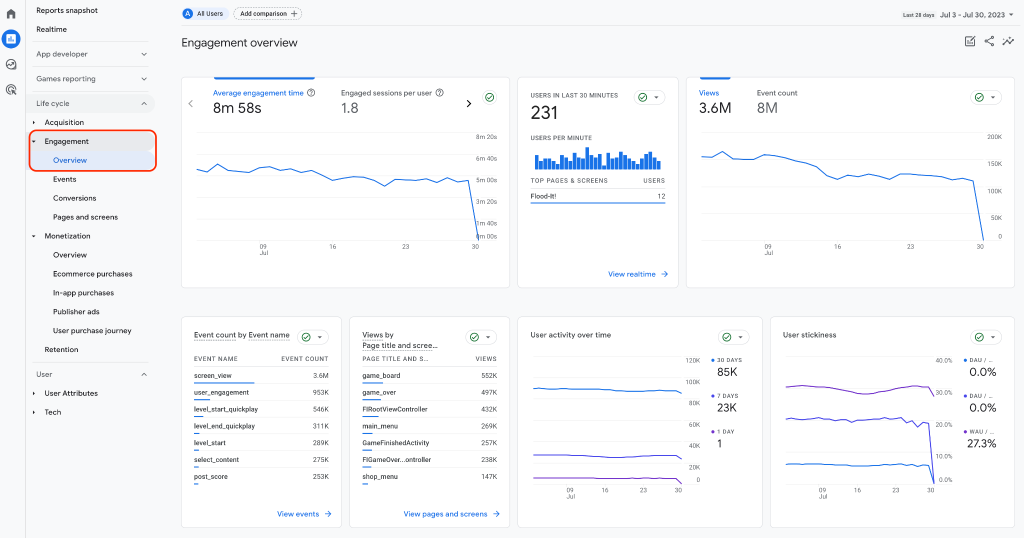
Overview Report
The Overview Report provides an overall perspective of the Engagement section in general.
Events
Events in GA4 track specific user interactions that you want to observe, such as clicks, downloads, video plays, or form submissions. It provides valuable insights into how users engage with your website or app, enabling businesses to optimize user experiences and identify areas for improvement.

Conversions
The Conversions section helps businesses track and measure specific user actions that lead to successful conversions, such as completing a purchase or signing up for a newsletter. The conversion report provides valuable information to help businesses optimize conversion funnels and increase overall conversions

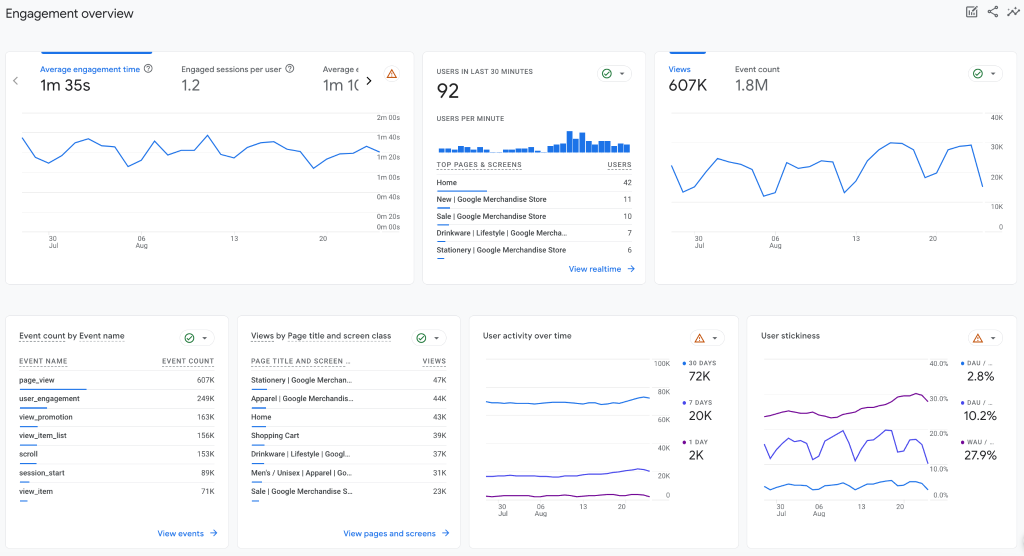
Pages & Screens
The Pages & Screens report presents data on the most viewed pages or screens on your website or app. It helps businesses identify popular content and user preferences, allowing for better content optimization and improving user engagement.

Landing Pages
The Landing Pages report analyzes the performance of different landing pages and their ability to convert visitors. It provides insights into how well landing pages resonate with users, enabling businesses to enhance landing page design and content for better conversion rates.
Example Scenario: Launching a Fitness Equipment App for the Business
As a Performance Marketer of fitness equipment, your company is launching a new Mobile Fitness App to build brand awareness, you want to track your user engagement within the app.
Data Analysis Example: Analyzing Landing Page Engagement
As the Marketer, you can use the Engagement report to understand user behavior within the app, such as average session duration, engagement rate, and pages per session. By analyzing this data, you can see how users are interacting with the app and identify areas for improvement. For example, if the average session duration is low, you might need to make a specific page on the app more engaging by adding more content or by improving navigation.
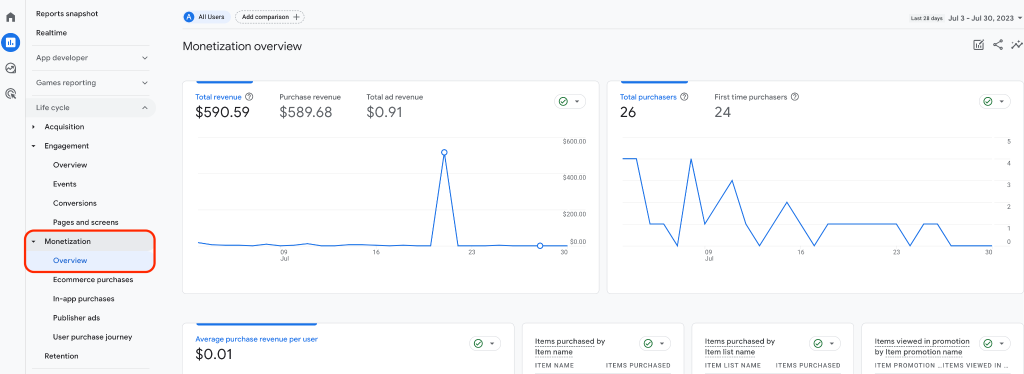
Monetization - “Understand Your Transactions, Purchase, & Revenue Related Events Better”
The monetization section helps businesses get insights from transactions, purchases, or other revenue-related events. This section includes the overview report, E-commerce purchases, user purchase journey, in-app purchases, publishers’ ads, and promotions. Let’s analyze each section in detail:
Overview Report
The Overview Report includes tracking revenue-related metrics and performance. Key monetization parameters, such as total revenue and average revenue per user, are summarized here.
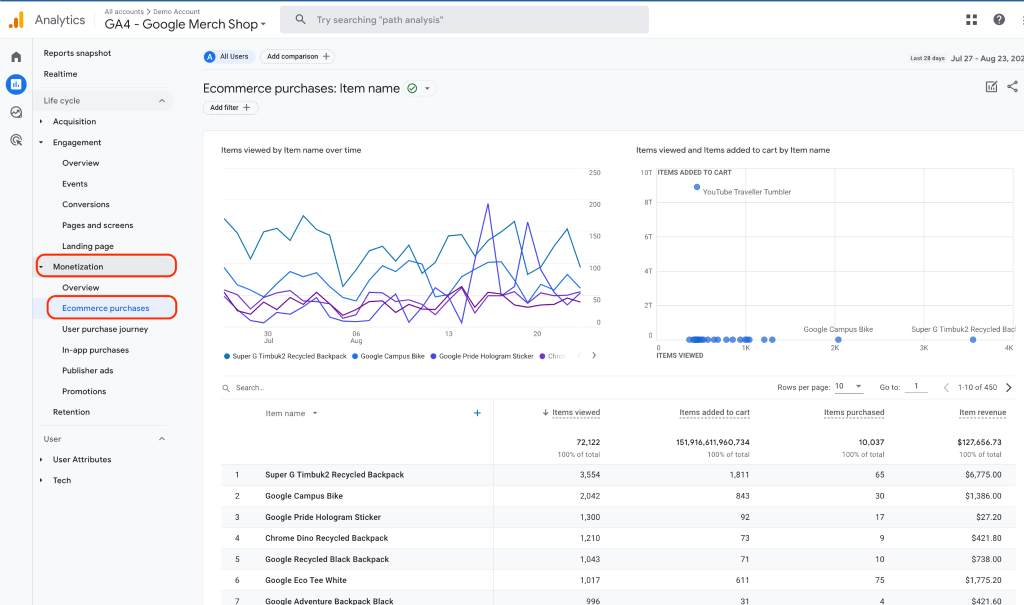
E-commerce Purchases
The E-commerce Purchases section in GA4 provides insights into online transactions and revenue generated from e-commerce activities. This section offers crucial data on product performance, transaction details, and revenue metrics, helping businesses to understand the effectiveness of their e-commerce efforts and optimize their online sales strategies.
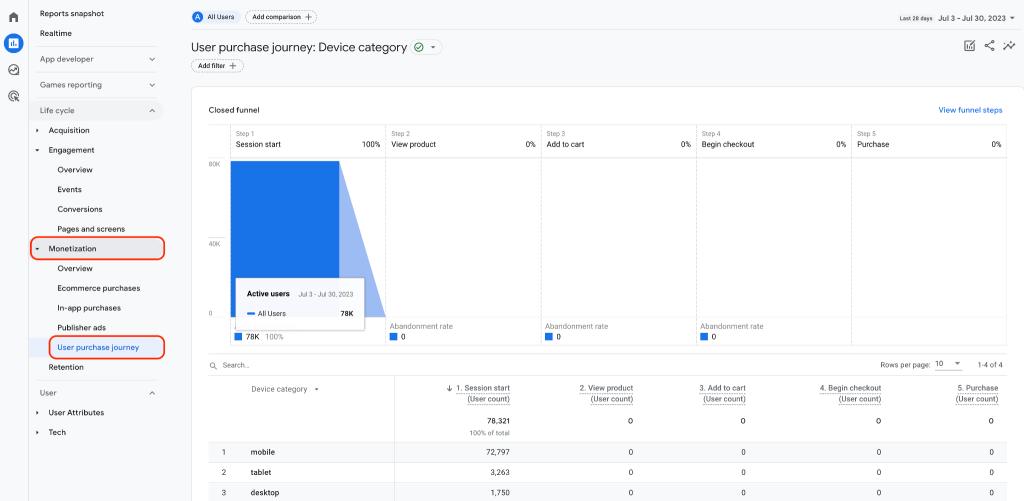
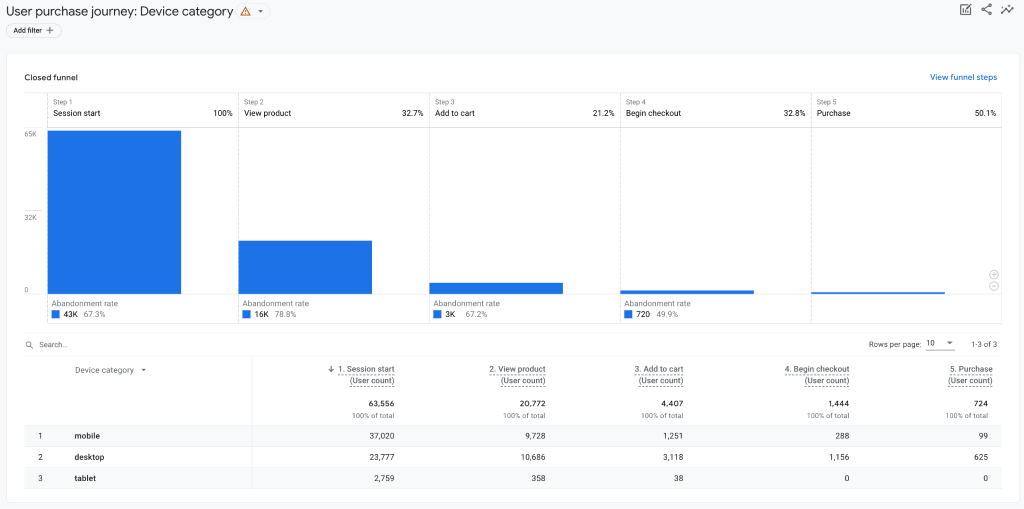
User Purchase Journey
This section tracks the steps users take before making a purchase on your website or app. It provides a detailed analysis of user interactions, from the initial touchpoint to the final conversion. Understanding the user purchase journey helps businesses identify potential roadblocks and optimize the sales funnel for better conversion rates.
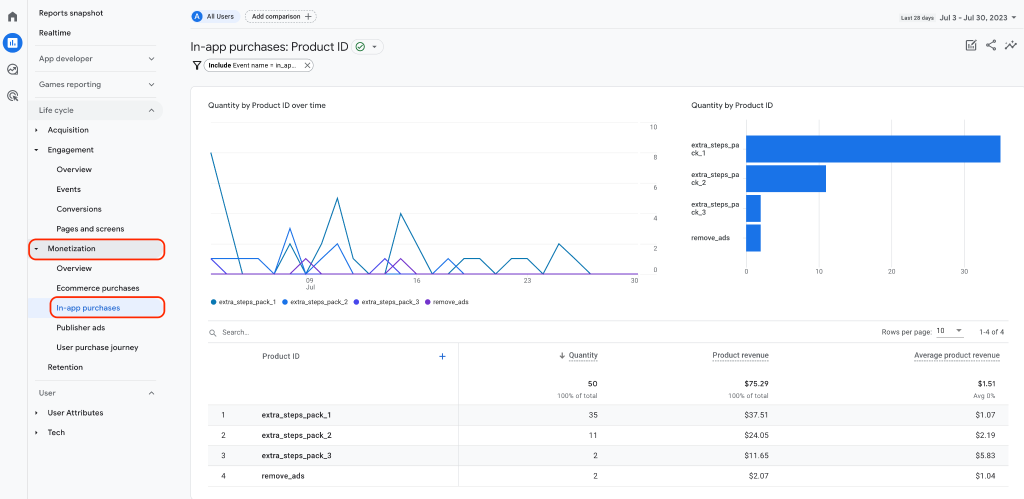
In-app Purchases
Specifically designed for app developers and this section focuses on tracking revenue generated from in-app purchases. In-app purchases occur through the Google Play Store or Apple Store within your app, eliminating the need to develop similar features. The information here provides insights into the performance of in-app transactions, helping marketers understand user spending behavior within their apps and improve their monetization strategies.
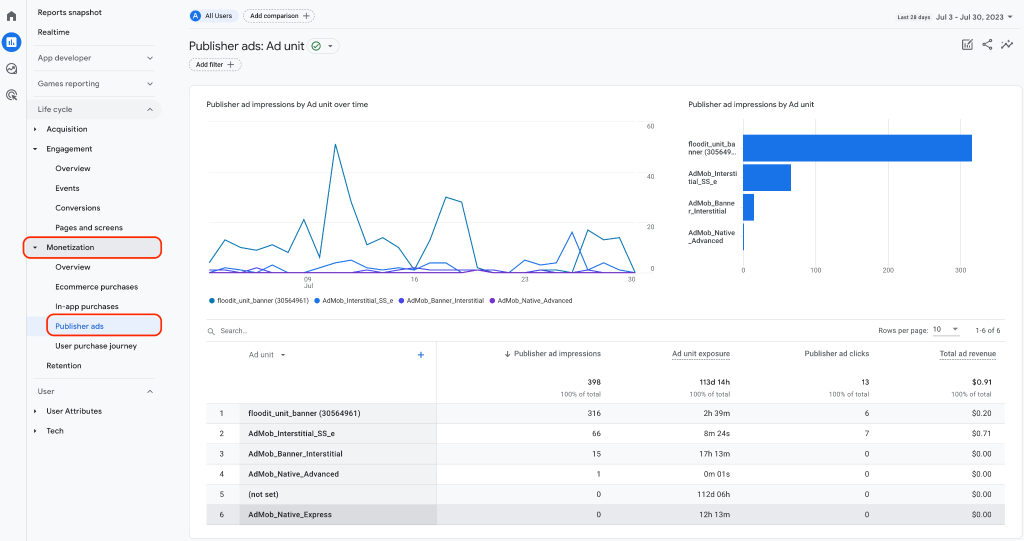
Publishers Ads
The Publishers Ads section analyzes the performance of advertisements on digital assets. It provides data on ad impressions, clicks, and revenue generated from ads. Publishers can use this information to optimize their ad placements and content, maximizing revenue from ad monetization.
Promotions
Offers valuable insights into the effectiveness of marketing promotions and campaigns. It helps businesses understand how different promotions impact user behavior and revenue. Businesses can refine their marketing strategies by analyzing promotion data to attract more customers and boost sales during promotional events.
Example Scenario: Enhancing E-commerce Sales
You are an Operation Specialist for a fitness equipment company your roles are to streamline the shopping experience and drive sales through effective marketing strategies.
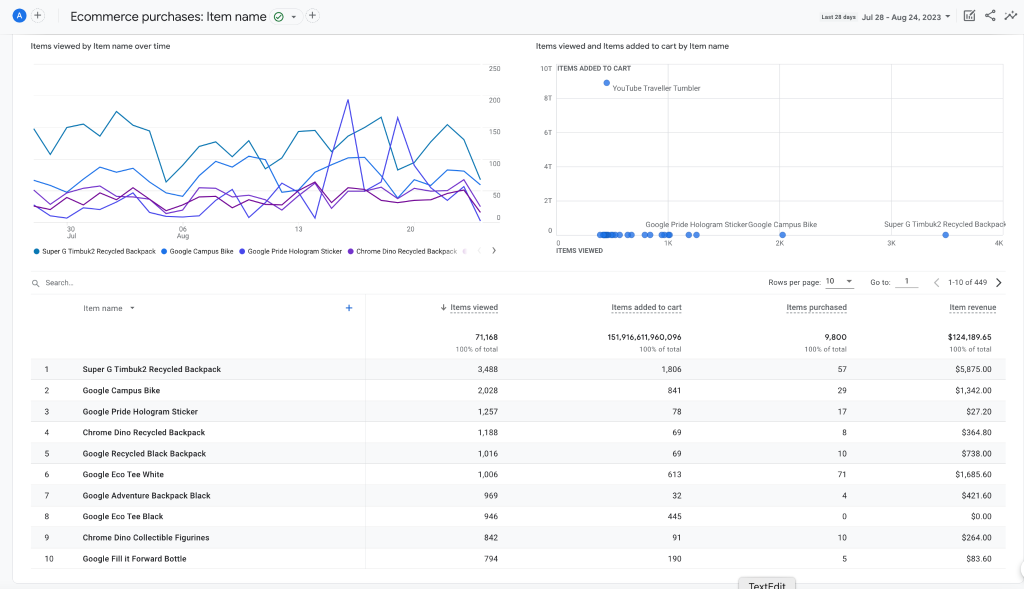
Data Analysis Example: Track Product Sales
To measure the success of your Ecommerce product sales, you go into the Monetization section and select Ecommerce purchases to view the product purchase journey. Here you can get a list of product items with their total number of items views, items added to the cart, items purchased, and item revenue. You can quickly identify the performance of each product item and its conversion rate, as well as identify the top conversion path across devices.
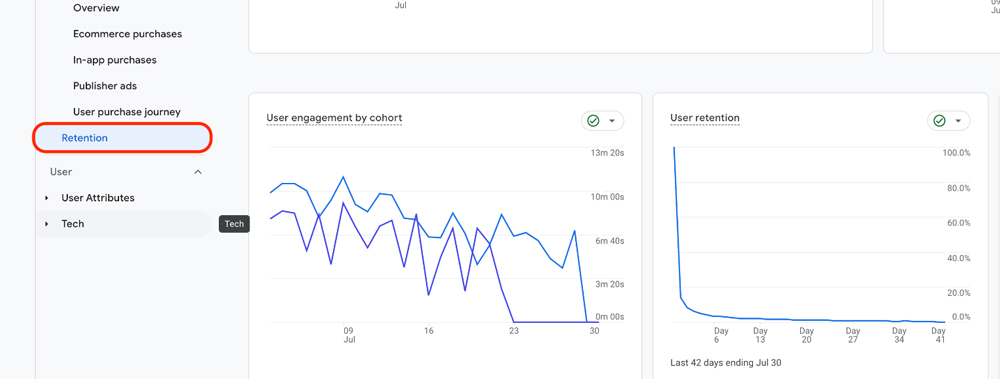
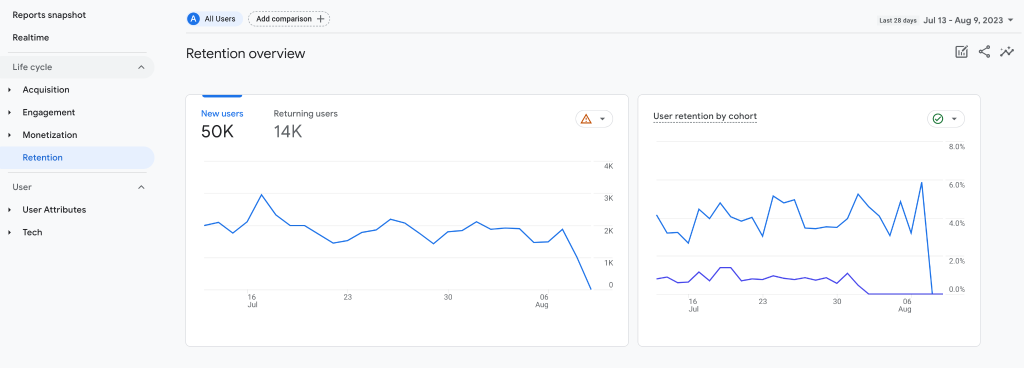
Retention
Insights about user retention and engagement over time are provided in GA4’s Retention section. By tracking user engagement by cohort, businesses can learn why specific customers are leaving while others are staying. Businesses may boost customer loyalty and engagement by analyzing retention data and implementing the findings.
Example Scenario: Enhancing Customer Loyalty on Paid Subscription for Fitness App
As a Project Manager for your fitness equipment company, you are responsible for a subscription-based online course on your Fitness app. Your objective is to increase customer retention, reduce churn, and maximize the lifetime value of subscribers.
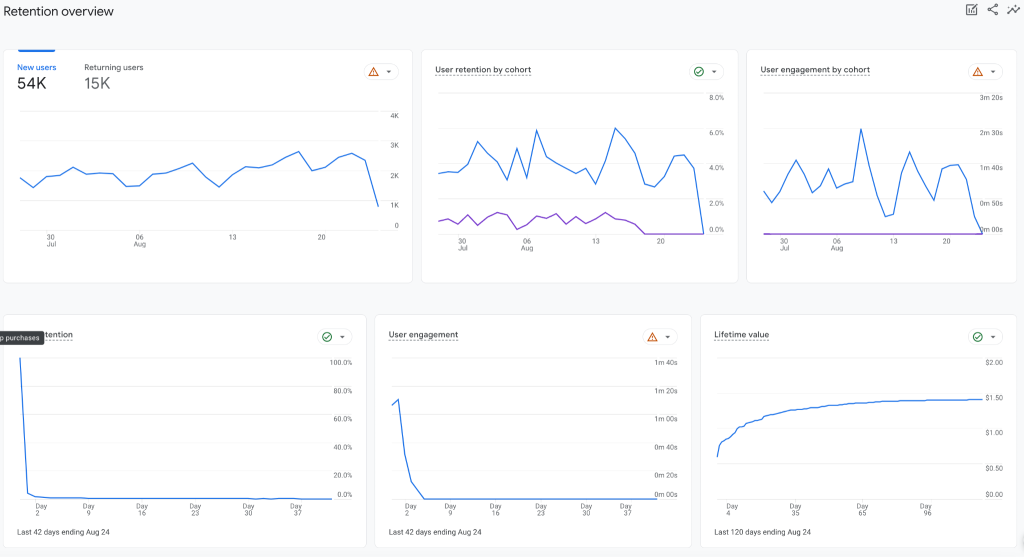
Data Analysis Example: Identifying Engagement Patterns
The ‘User Engagement’ tab within the Retention section reveals that subscribers who consistently use the service for a month tend to remain engaged over time. This information guides your strategy to focus on keeping new subscribers actively engaged during their initial month, enhancing their likelihood of becoming long-term users.
Analyzing User Behavior
Google Analytics 4 helps to analyze user behavior by following a user from the moment they first visit a website or app till the moment they leave. Businesses can learn a lot about their customers and their buying habits by analyzing user demographics and interests. Using user attributes permits efficient data segmentation and analysis, helping organizations to spot patterns more quickly and create better evidence-based strategies.
The characteristics and preferences of users can be better understood through the collection and analysis of demographic and user-attribute data. To better analyze user behavior, businesses can create specific user properties. Information on the devices users access digital assets from, including Platform and Device Categories, can help businesses create superior user experiences.
The “Users” section in GA4 consists of 2 main parts, the User Attributes & Tech. Information on user behavior, demographic details, and audiences are shown here. Let’s explore this section more below.
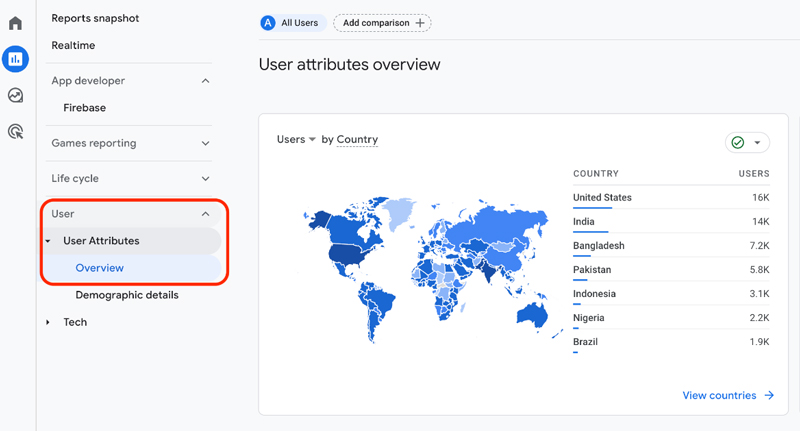
User Attributes
GA4’s User Attributes section provides in-depth knowledge of audience characteristics and behavior. Users’ ages and gender composition can be broken down into finer points using
demographic data. Organizations must first gain a thorough understanding of user attributes to target specific audience segments with targeted marketing tactics and content.
Overview:
The Overview summarizes the information about users, including demographics like age and gender, as well as interests and geography.
Demographic Details:
The GA4 Demographic Details section provides essential insights into the age, gender, and interests of our user base, enabling us to tailor our marketing campaigns for maximum relevance and effectiveness.
Example Scenario: Launching a New Fitness Equipment Product
Imagine you’re a Performance Marketer for a Fitness Equipment Brand preparing to launch a line of fitness products. Your goal is to create campaigns that resonate with your target audience and maximize conversions.
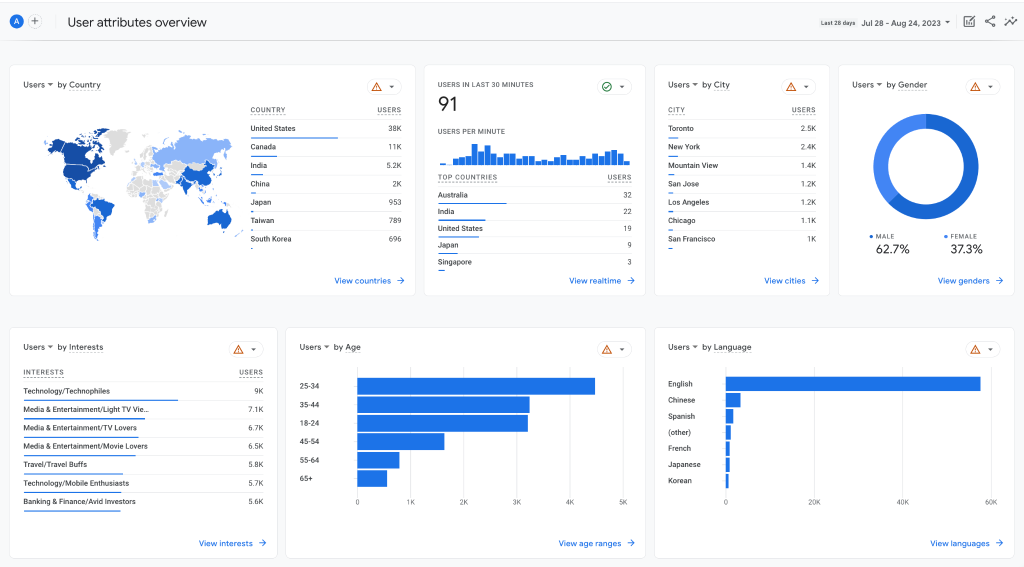
Data Analysis Example: Understanding Age Demographics
You access the GA4 Demographic Details section to explore the age distribution of your website visitors. Here, you discover that the majority of your visitors fall within the 25-34 age range, are female, like yoga, and use iOS (Apple Products). Based on this insight, you tailor your campaign messaging, visuals, and social media content to align with the preferences and lifestyles of this demographic.
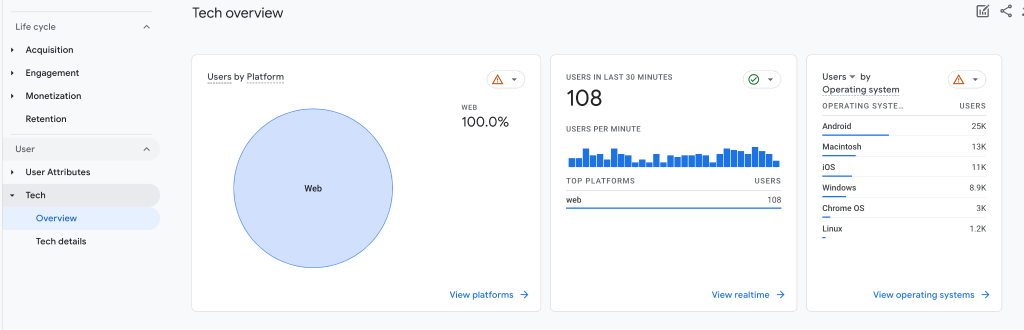
Tech
In the ever evolving landscape of digital marketing, understanding users’ technology preferences is vital for delivering seamless experiences.
Overview:
The overview section gives a general overview of the technologies that are being used. Companies can better tailor their digital offerings by learning their customers’ preferred technologies.
Tech Details:
Events in GA4 track specific user interactions that you want to observe, such as clicks, downloads, video plays, or form submissions. It provides valuable insights into how users engage with your website or app, enabling businesses to optimize user experiences and identify areas for improvement.
Example Scenario: Optimizing Mobile User Engagement
Exploring the ‘Screen Resolution & Device Type’ details, you notice that a considerable number of mobile users are on smaller screen resolutions. This insight prompts you to adjust your mobile layout to ensure they’re visually appealing and easily navigable on smaller screens. By tailoring your ad formats, you increase the chances of capturing users’ attention and encouraging engagement.
Data Analysis Example: Tailoring Mobile Experience
Exploring the ‘Screen Resolution & Device Type’ details, you notice that a considerable number of mobile users are on smaller screen resolutions. This insight prompts you to adjust your mobile layout to ensure they’re visually appealing and easily navigable on smaller screens. By tailoring your ad formats, you increase the chances of capturing users’ attention and encouraging engagement.
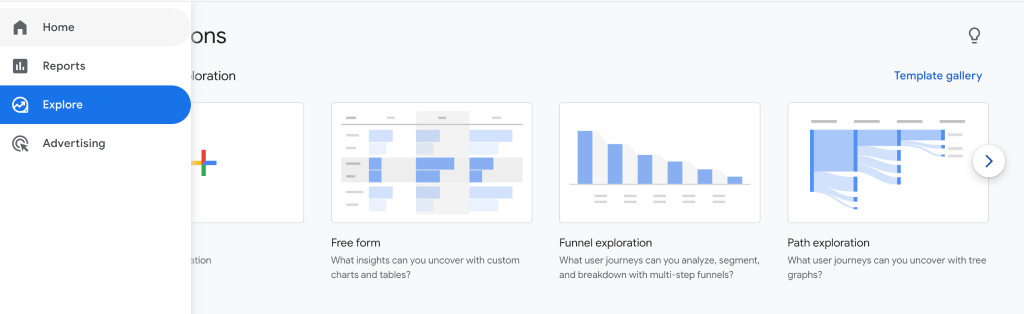
Explorations: “Customize Reports To Your Needs”
The “Explore” section in GA4 offers a range of data exploration and analysis tools to gain deeper insights into the performance and behavior of a website or app. It allows users to create Google Analytics custom reports and visualizations, assisting businesses to uncover valuable patterns, trends, and opportunities from their data. The Explore section helps users to make data-driven decisions and optimize their digital strategies for better outcomes.
Google has report templates that you can customize. Let’s explore some of the most popular ones here.
Canvas:
You can start with a blank canvas to customize your exploration. This section allows you to have multiple tabs, letting you use multiple techniques in a single exploration.
Free-form exploration:
You can apply several different visualization styles in free form- bar charts, pie charts, line charts, scatter plots, and geo maps.
Cohort exploration:
Gain insights from the behavior and performance of groups of users related by common attributes.
Funnel exploration:
Visualize each step users take to complete tasks on your site or app and identify over or under-performing audiences.
Segment overlap:
See the correlation between different user segments. This report can help to identify new segments of users who meet special criteria.
User exploration:
Look into the users that make up the segments you create or import. You can also explore each individual user’s activities.
Path exploration:
Visually track the paths your users take as they interact with your website and app.
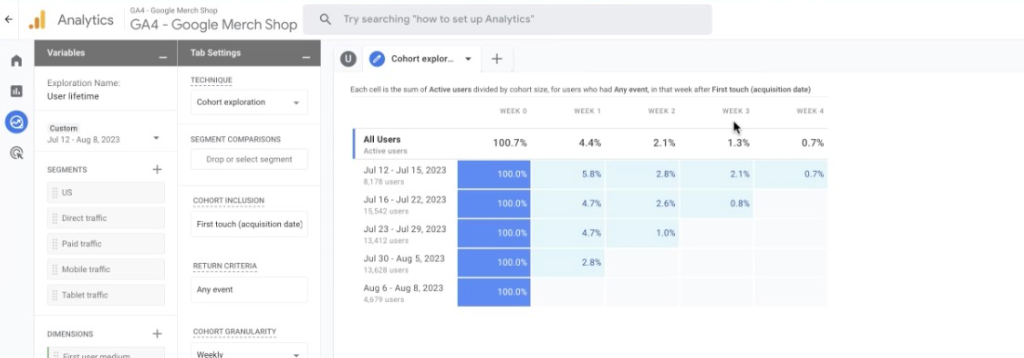
Example Scenario: Using Exploration Cohort Reports for More Details
As a growth marketer for the fitness equipment brand, you want to better understand the retention of your users and why they are leaving. You visit the retention report to find that the report is lacking the details that you need. In the chart above, the retention data is displayed in a line chart which gives very limited information.
Data Analysis Example: Customize data for better analysis
The exploration section can help you better extend data analysis by creating custom reports to help you understand the data better. Inside Cohort exploration, the User Lifetime report tracks the percentage of active users who remain each week after they are acquired. This information can be used to identify trends in user retention and make necessary adjustments to your engagement and retention strategies.
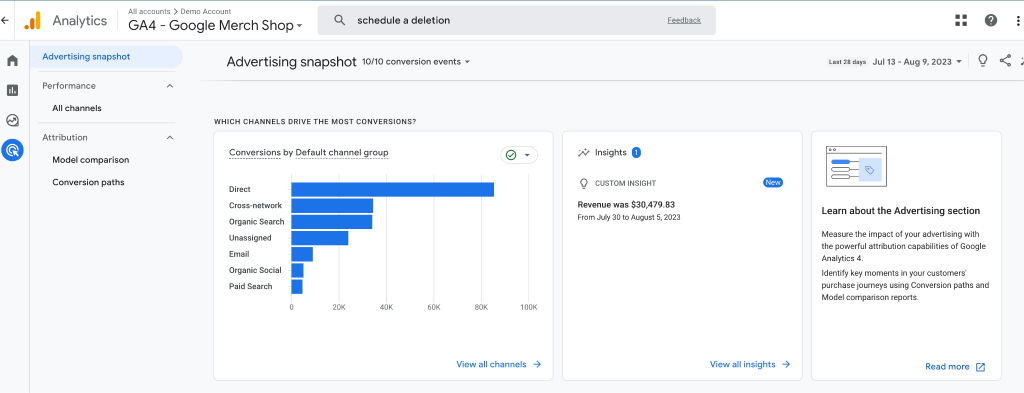
Advertising: “Stop Wasting Money on Ineffective Advertising”
The “Advertising” section in GA4 is dedicated to tracking and analyzing the effectiveness of advertising campaigns across various channels. By using the Advertising section in GA4, businesses can make informed decisions to enhance their advertising performance and achieve their marketing goals.
The main difference between the Acquisition report and Attribution model comparison in GA4 is that the Acquisition report shows how users are acquired from different marketing channels, while the Attribution model comparison report shows how different attribution models assign credit to touchpoints on conversion paths.
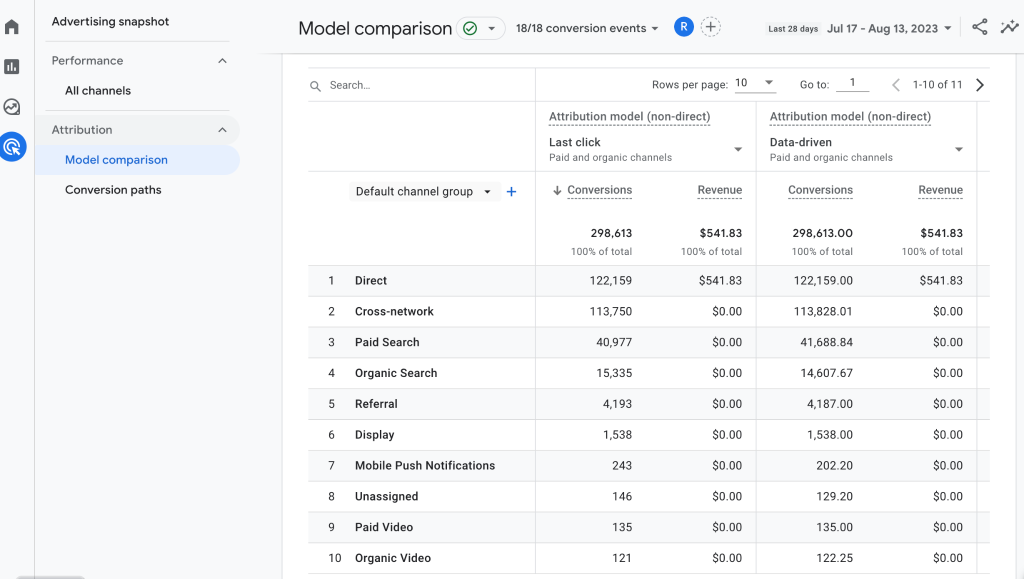
Example Scenario: Track Successful Campaigns
As a performance Marketer, you’d like to track successful ad campaigns that led to conversions within the last 28 days.
Data Analysis Example:
By using the Model comparison report, you can easily see how your organic marketing channel compares to your paid advertising channels and quickly identify undervalued campaigns. This information can help you to shift your ad campaigns and budget to the most effective channels and improve your overall results.
Integrating GA4 with Other Tools
By integrating Google Analytics 4 (GA4) with other tools, businesses can significantly improve their data analysis and gain a bird’s-eye view of their digital footprint. When companies optimize their data sources and records for GA4, they have better information on which to base decisions.
Integrating GA4 with Google Ads and Google Search Console gives businesses insight into the performance of their advertising campaigns and the behavior of visitors who find their sites via organic search. Users may quickly and easily build compelling reports highlighting crucial insights from their datasets by combining GA4 with data visualization tools like Looker Studio. Want to learn more, read our article What is Looker Studio & Its Benefits For Businesses.
Businesses can access raw, unaggregated data using Google Analytics 4 with BigQuery, enabling more in-depth research and customized queries that ultimately lead to more meaningful insights. Integrating GA4 with other technologies can help businesses save time and effort by standardizing and streamlining data analysis processes.
Vpon Big Data Group is a leader in big data applications & solutions. Offering services in digital transformations, big data analytics, data management, data monetization, and more. Our data experts offer workshops and exclusive consulting services on data analysis with GA4 to help you make informed decisions that will boost your business growth. Get
Data Privacy and Compliance
Due to the importance of data privacy in the modern digital ecosystem, Google Analytics 4 includes measures to comply with regulations like the General Data Protection Regulation (GDPR) and the California Consumer Privacy Act (CCPA). Businesses must obtain consent from individuals before collecting and processing personal data under the GDPR or CCPA.
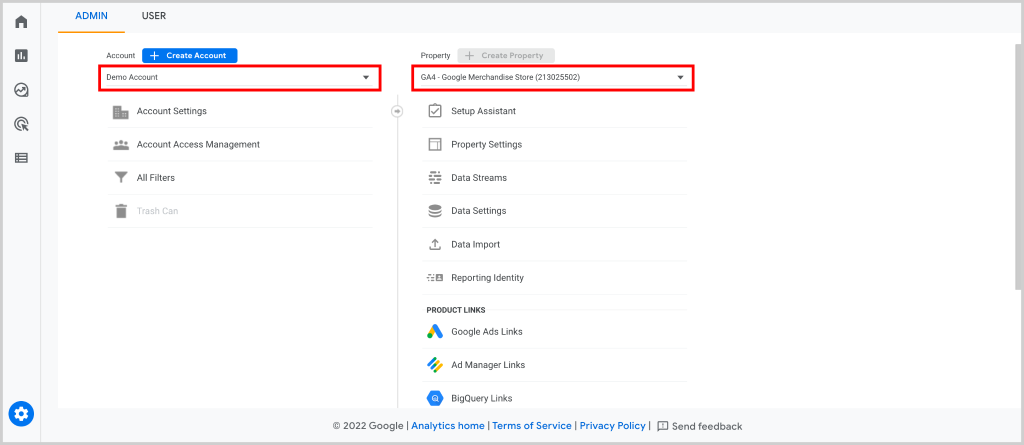
GA4 satisfies GDPR requirements by enabling administrators to specify retention and deletion policies for collected data. The image above shows how you can schedule a deletion of the data in GA4.
In addition to managing data, GA4 also allows businesses to implement data protection strategies like IP anonymization to safeguard user data and ensure compliance with data privacy standards. Using GA4’s privacy-centric features to maintain users’ trust and conform to evolving data privacy regulations can help businesses improve their online credibility and reputation.
Summary and Key Takeaways
Google Analytics 4 data analysis expertise is essential in today’s competitive business environment. GA4’s in-depth analysis of user actions, advertising efforts, and real-time information helps businesses make more informed decisions. Businesses can improve their marketing strategies and expand by using cutting-edge data analysis methods and merging them with other resources. Maintaining credibility and confidence requires following data privacy laws. Businesses may grow and maintain their competitive edge by adopting GA4.